
Air pollution is the prime environmental factor driving disease, with approx. 400 000 premature deaths attributed to air pollution in the EU every year.
Air pollution emitted from large industrial sites in Europe did cost society between €277 and €433 billion (about 2-3 % of EU GDP in 2017), just for the reference year 2017 [see ETC/ATNI (EEA) study ‘Costs of air pollution from European industrial facilities]. This study refers only to the air pollutants of the largest scale activities, not considering new IED 2.0 activities such as Mining, more pig/poultry farms and Gigabatteries production.
A more up to date study by the EEA of 2024 confirms that the external damage costs due to EU industrial activities are still in the €268 to €428 billion per year range! The EEA confirms that a significant pollution decrease (80% is to be attributed to the uptake of (stricter) BAT, the shifting to renewables and phase out of fossil fuels thanks to EU policy action.
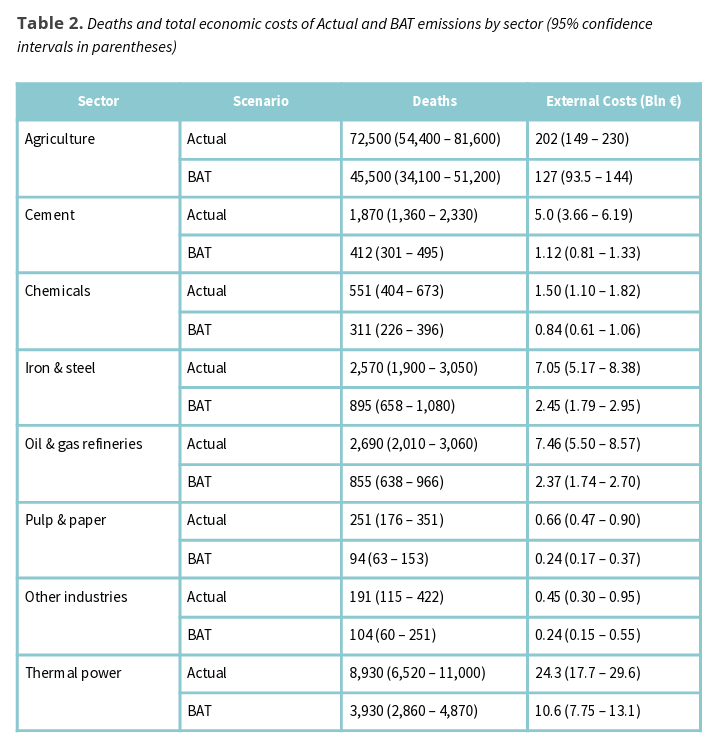
During the IED review, the EEB made the case that forcing the uptake of strict BAT-AEL at national level saves lives and money. The CREA study (2023) “Upgrading Europe’s air: how a strong IED can save lives and money” reveals that 10,000 annual deaths with an external cost of 28 billion per year could have been avoided through the application of BAT for thermal combustion, oil and gas refineries and iron and steel as well as cement production.
Stricter BAT on livestock rearing could have avoided 27,000 annual deaths with an external cost of 75 billion per year, just in relation to air pollution alone. The sectoral comparison on the main air pollutants provided below:
The (worst) top 10 (absolute damage costs) responsible polluters hosting countries are: Germany, France, Italy, Poland, Spain, UK, Belgium, Czech Republic, Romania and Hungary. For livestock, the top 3 are Germany, France and Italy.
Further information:
- Please check out the EEB’s Industrial Plant Data Viewer (IPDV), providing more detailed information on performance information and negative impacts from large combustion plants.
- Based on the IPDV datasets, we also provided detailed country and EU factsheet on Large Combustion Plants. EU countries had four years to ensure operators of large combustion plants are in line with the 2017 best available techniques to prevent pollution (BATs). These country factsheets show where they were at in 2017, while the EU factsheet sheds a light on the best and worst performers.
